06 Functions of multiple variables, part 2
More plotting strategies for graphs
Strategies for plotting graphs of \(f: \mathbb{R}^2 \to \mathbb{R}\)
- Intersect the graph with horizontal planes of the form \(z=c\), for various values of \(c\).
- The equation you solve is \(c = f(x,y)\).
- These cross sections (also called level sets!) are curves in the \(xy\)-plane.
- Intersect the graph with vertical planes of the form \(x=c\), for various values of \(c\).
- The equation you solve is \(z=f(c,y)\).
- These cross sections are curves in the \(yz\)-plane.
- Intersect the graph with vertical planes of the form \(y=c\), for various values of \(c\).
- The equation you solve is \(z=f(x,c)\).
- These cross sections are curves in the \(xz\)-plane.
Exercise 1: Practice with cross sections
Plot the graphs of the following functions by using cross sections.
- \(f(x,y) = x^2 - y^2\)
- \(g(x,y) = y\sin{x}\)
- \(h(x,y) = -2x - y +5\)
- \(k(x,y) = y^3 + xy\)
Contour plots
Placing all of the level sets of a function \(f:\mathbb{R}^2 \to \mathbb{R}\) in the \(xy\)-plane gives us a contour plot of \(f\).
- So, a contour plot is like a topographic map of the graph of \(f\).
- In this context, the level sets are often called contours or contour lines.
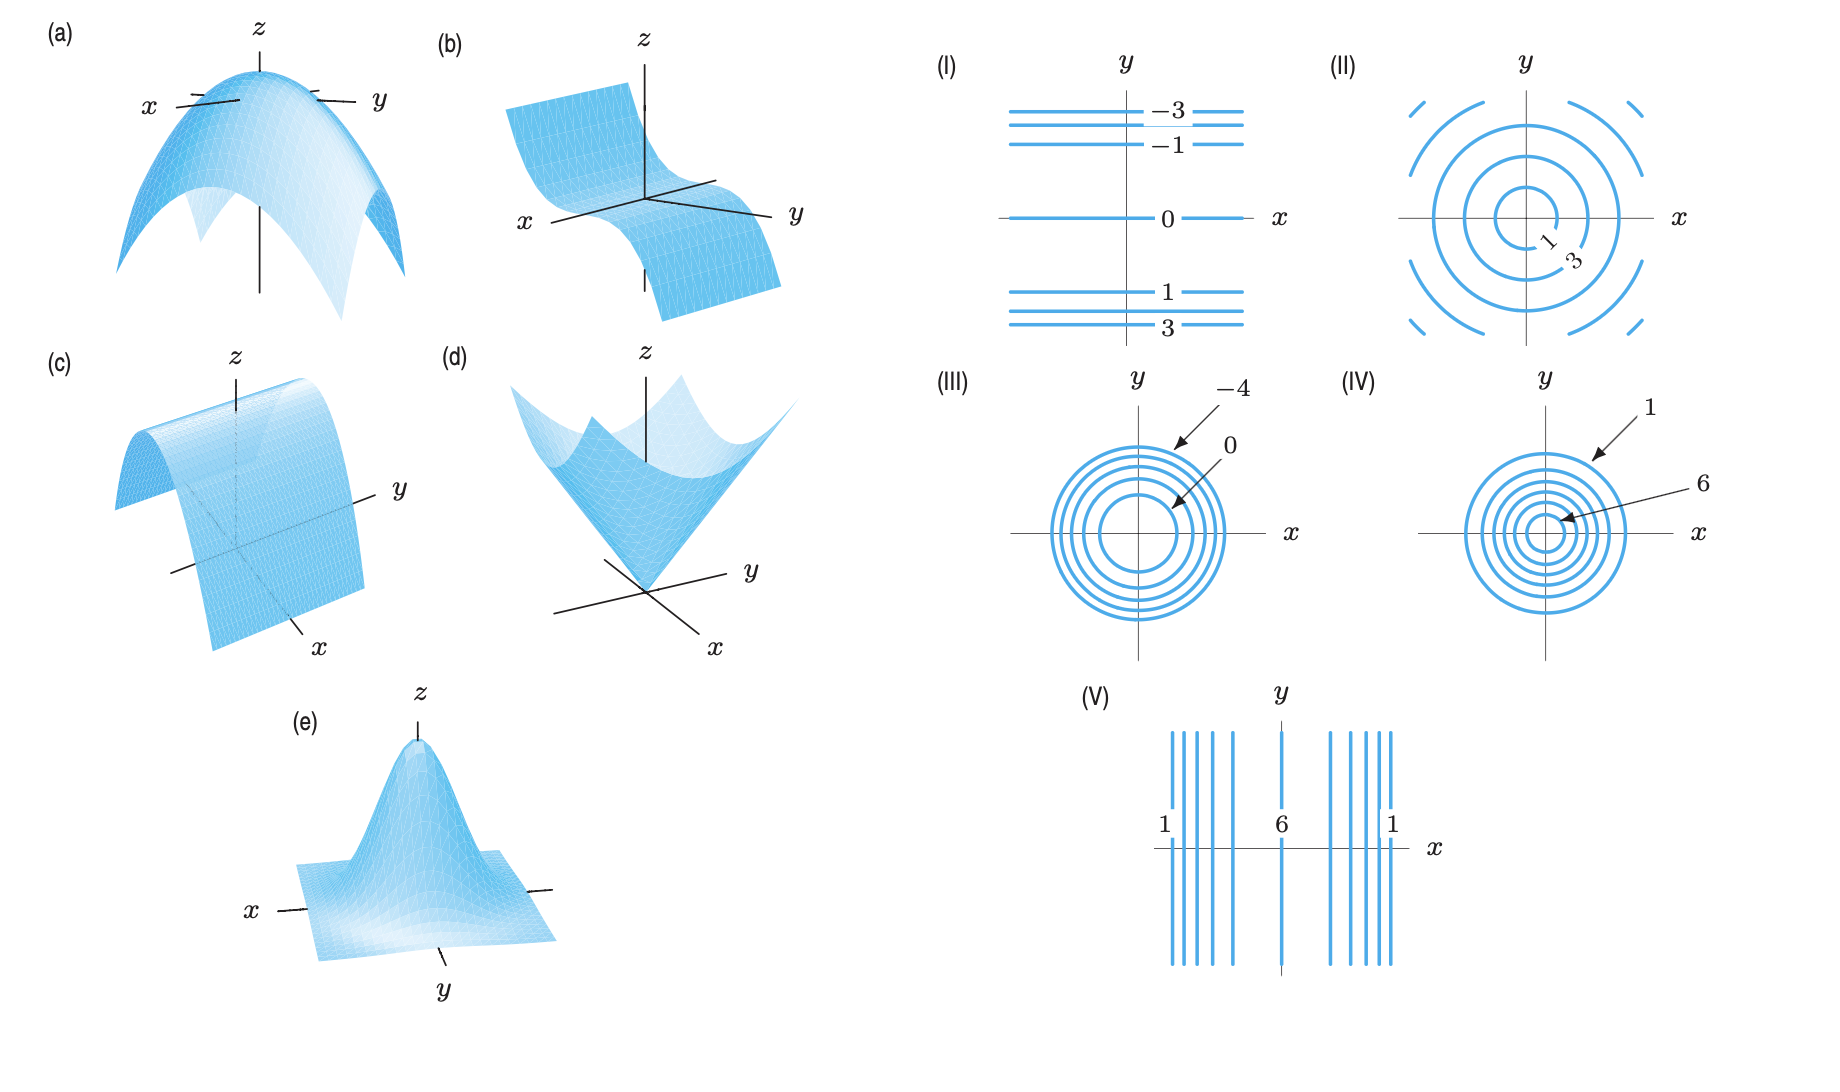
Exercise 2: Matching contour plots
Match the graphs to the contour plots.
Exercise 3: Sketch a contour plot
Sketch a contour plot for the function \(f(x,y) = xy\).